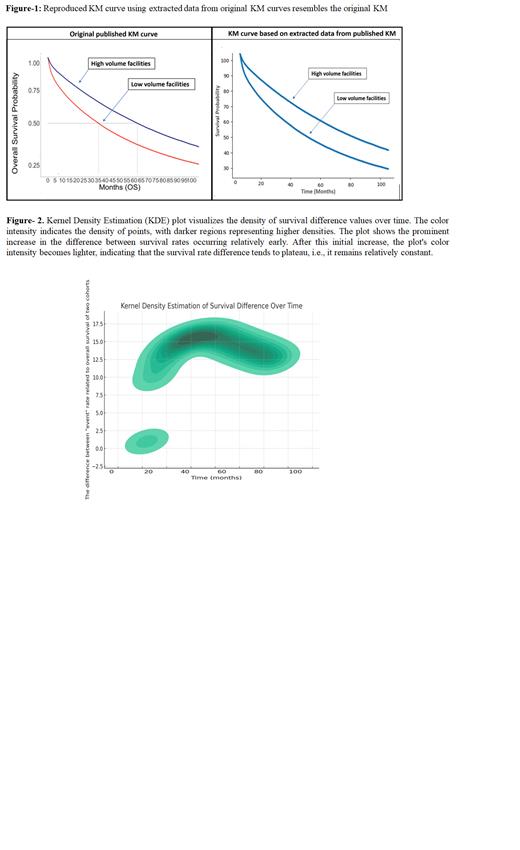
In 2000, the Institute of Medicine highlighted significant evidence supporting a positive association between higher surgical oncologic procedure volume and improved clinical outcomes. Over nearly two decades since that report, research on the volume-outcome relationship in hematologic malignancies remains somewhat unclear. Most of the research on the impact of procedural volume in Multiple Myeloma (MM) management has relied on the National Cancer Database (NCDB), which consistently indicated that MM patients treated at higher-volume facilities experienced lower mortality rates compared to those treated at lower-volume facilities. Still, the underlying reasons for this disparity have remained elusive.
In our pursuit of understanding the underlying factors contributing to the survival disparities in MM, we delved into the data from the NCDB studies. Notably, we observed a significant separation in the Kaplan-Meier (KM) curve for overall survival (OS) between patients treated in high-volume and low-volume facilities during the first 2-3 years. However, intriguingly, the divergence in survival rates tended to plateau after this initial period, with similar event rates observed between the two cohorts in subsequent years. This observation led us to question whether hidden biases or confounding factors might influence the outcomes beyond the scope of traditional analyses.
Artificial Intelligence (AI) and machine learning algorithms offer powerful tools for unraveling complex patterns and identifying subtle biases in large datasets. By leveraging these advanced techniques, we aim to dig deeper into the NCDB data to uncover potential hidden factors influencing the survival disparities among MM patients. Objective: To assess the early separation of KM curves, and potential violation of proportional hazard assumptions, we used image analysis software to extract survival numerical value from the KM graph of major three studies of NCDB. We hypothesized that majority of significance in the survival between high vs low volumes occurs in the first 3 years and after that the difference in death rate remains stable.
Methods: We included three main analyses of NCDB with KM curve assessment of high vs. low volume facilities. The Computer Vision 2 module on Python programming was used to convert the KM graph image to a gray-scale version. Then the X and Y coordinates of both lines were extracted. The vertical distance between two Y values for each value on X-axis was calculated as the difference between event rates in two cohorts. Further, we created a cumulative hazard plot to visualize the cumulative hazard function for each group over time. This plot can provide insights into whether the proportional hazard assumption holds. Kernel Density Estimation (KDE) was utilized for estimating probability densities from the underlying distribution.
Results: We successfully reproduced the KM curve using the coordinates' numerical value (Figure-1).Kernel Density Estimation (KDE) plot visualizes the density of survival difference values over time. The color intensity indicates the density of points, with darker regions representing higher densities. The plot shows the prominent increase in the difference between survival rates occurring relatively early (roughly 30-36 months). After this initial increase, the plot's color intensity becomes lighter, indicating that the survival rate difference tends to plateau, i.e., it remains relatively constant. A large portion of the difference between the two curves occurs early in the course and, after that, stays stable, illustrating early separation in the KM curve.
Conclusion: Our findings illustrate that the main survival difference between high and low-volume facilities for MM treatment occurs early in the disease course, potentially violating the proportional hazard assumption. This divergence from expectation may be attributed to patient migration from lower to higher-volume facilities over time, influencing survival data. In light of this, we recommend using alternative approaches, such as cumulative hazard plots and time-varying coefficient Cox models, to assess the Proportional Hazard assumption for patient volume in future research.
Disclosures
Malek:Karyopharm: Speakers Bureau; Medpacto Inc.: Research Funding; BMS: Consultancy; Sanofi: Consultancy; Amgen: Speakers Bureau; Cumberland Inc.: Research Funding.


